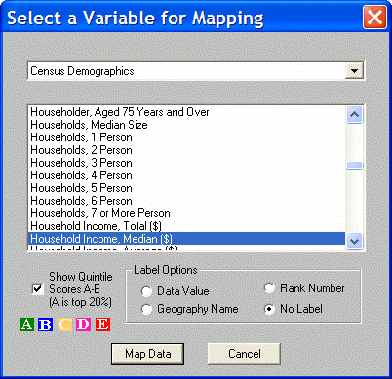
The Select a Variable for Mapping controls which information from the selected records is presented on the map and how each area is presented. Each area in the Summary Report is plotted on the map.
Show Quintile Scores A-E causes each area to be shown with an A,B,C,D, or E icon on it. This score represents with quintile within which the selected variable falls. This score is equivalent to the EASI Score. One of the following label options can also be displayed next to each point:
Data Value displays the raw value of the selected variable.
Rank Number displays the rank of the area within the summary list. This is NOT the same as the EASI Rank.
Geography Name displays the name of each area.
No Label displays nothing other than the points themselves. This is the default setting for Select a Variable for Mapping.
Map Data causes the currently selected settings to be drawn on the map.