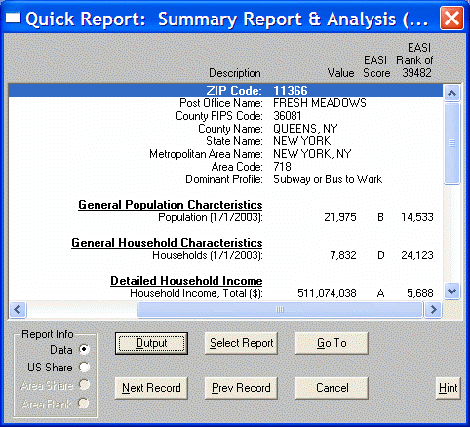
Detailed Reports are available from Quick Reports, the Record Report option from Summary Reports, and from Express Save.

Output sends the data in the report to a printer, a text file, or a database file.
Select Report allows the information in the Detailed Report Window to be changed. Choose from any report in the EASI Select Reports option.
Go To selects a record number to go to. The record number refers to the database record number in a Quick Report. If Record Report has been chosen from the Summary Report, the record number refers to a position in the Summary Report list.
Next Record moves to the next record. The next record refers to the database sequence in a Quick Report. In a Record Report from the Summary Report, the next record refers to a position in the Summary Report list.
Previous Record moves to the previous record. The previous record refers to the database sequence in a Quick Report. In a Record Report from the Summary Report, the previous record refers to a position in the Summary Report list.
Data option displays a Data Value, an EASI Score and an EASI Rank for each selected field. This the default choice for Detailed Reports. This selection shows how the chosen area compares to other areas in the US.
US Share option displays a Data Value, a %US, and a Concentration Index. The Concentration Index (CI) is the ratio of two percentage shares of the US (the denominator is always the percent of the US Population for that particular geography expressed a percent). This result is multiplied by 100 (US Average =100) to arrive at the Concentration Index. For example, if Income as a percent of US is 2.000000 % and the Population Percent of the US is 1.00000 %, the CI for Income would be (2.000000/1.000000 times 100 = 200).
Area Share shows a %Area and a Concentration Index relative to the entire Study Area selected with Site Study Select/Remove Filter. The Concentration Index (CI) is the ratio of two percentage shares of the selected area and the entire Study Area (the denominator is always the percent of the entire Study Area Population for that particular geography expressed a percent). This result is multiplied by 100 (US Average =100) to arrive at the Concentration Index. For example, if Income as a percent of the selected area is 2.000000 % and the Population Percent of the entire Study Area is 1.00000 %, the CI for Income would be (2.000000/1.000000 times 100 = 200).
The Area Share illustrates how the chosen area compares to other areas within the Study Area.
Area Rank shows the EASI Score and EASI Rank relative to the study area selected with Site Study Select/Remove Filter. This selection illustrates how the chosen area compares to other areas within the Study Area.
Detailed Reports will look slightly different than the screen shown above for Trend Reports and Multiple Ring Study Reports.